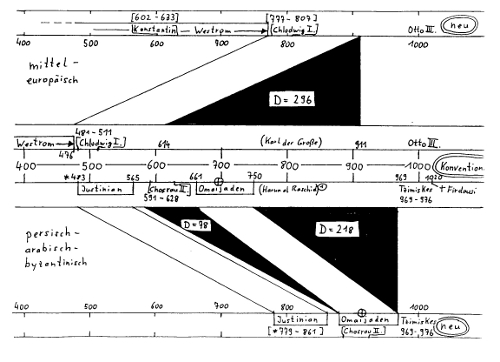
The center of the graph shows the time axis of conventionally dated historical events. Upper and lower coordinates show reconstructed time tables. The black triangles mark the phantom years.
 Diesen Artikel drucken
The center of the graph shows the time axis of conventionally dated historical events. Upper and lower coordinates show reconstructed time tables. The black triangles mark the phantom years.


![]()
![]()
![]()